
The supplier market and Gullfaks

The development of Gullfaks was one of the most extensive industrial undertakings in Norway during the 1980s. Behind the massive platforms and multi-billion investments lay a complex network of contracts: for drilling, concrete, pipeline installation, and platform design. This article provides an overview of the competitive landscape among suppliers involved in the Gullfaks project.
The article is based on a 2000 report by senior researcher Hildegunn Kyvik Nordås at the Chr. Michelsen Institute. The report analyses how contracts were distributed across different phases of the Gullfaks project, how concentrated the supplier industry was, how many bids were submitted for various contracts, and the role of Norwegian companies in the process.[REMOVE]Fotnote: Nordås, H. K. (2000). Gullfaks: The first Norwegian oil field developed and operated by Norwegian companies. Chr. Michelsen Institute, Development Studies and Human Rights. https://open.cmi.no/cmi-xmlui/bitstream/handle/11250/2436110/WP2000-13.pdf?sequence=2&isAllowed=y
The report offers valuable insights into market concentration across different segments of the supplier industry and into the central position Norwegian firms held during this period.
To structure her analysis, Nordås categorised suppliers into four main groups:
- Engineering services: Planning, design, project management, and technical support related to field development and operations.
- Maritime services: Ship- or vessel-based tasks such as transport, pipeline installation, seismic surveys, and diving.
- Non-maritime services: Well-related operations such as drilling, cementing, maintenance, and platform catering.
- Goods and materials: Delivery of materials, equipment, and modules to support platform development and operations.
In addition, contracts are grouped into three project phases: exploration, development, and operations.
The breakdown of contracts shows that maritime services dominated spending during the exploration phase; goods were the largest expense during development; and non-maritime services were most significant during the operational phase.
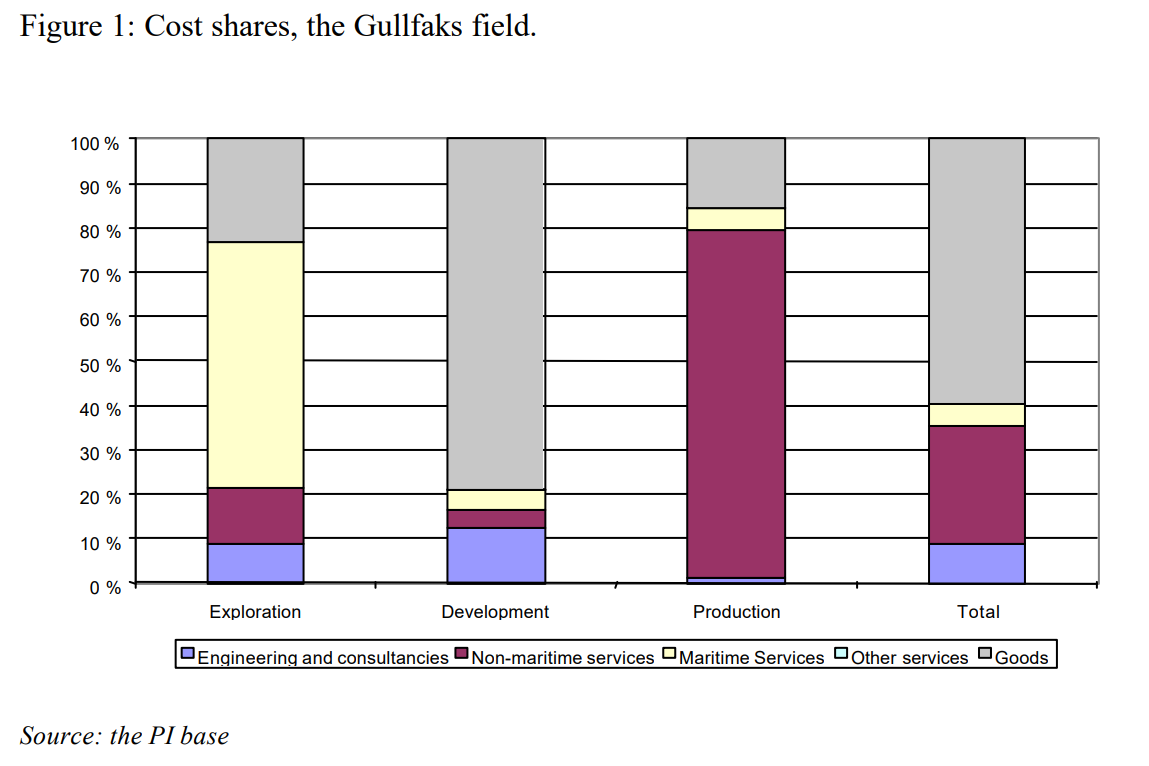
As of 2000, the development phase remained the largest in terms of contract value, accounting for 63 percent of total spending. The operations phase represented 36 percent, while the exploration phase accounted for less than 1 percent.
A concentrated supplier industry
The supplier market surrounding Gullfaks was characterised by a small number of large players, particularly during the development phase. The Norwegian companies Aker and Kværner dominated this segment, with 33 percent and 12 percent of total contract value, respectively. Both held strong positions in areas such as deck construction, module delivery, and outfitting of platform shafts.
The market concentration was reflected in the low number of bidders per contract—typically only two or three. The table below shows the average number of bids received for selected contract types related to the Gullfaks project.
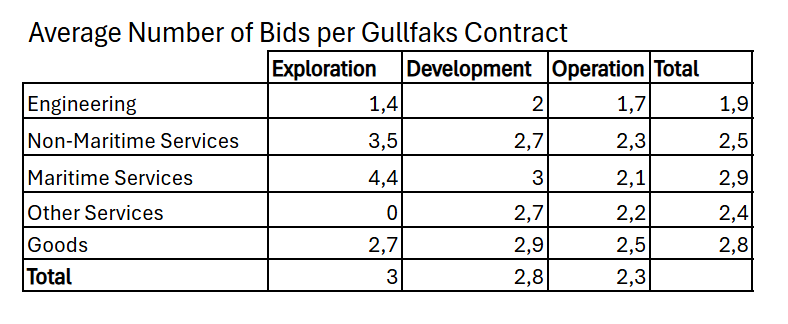
Engineering services stood out with the fewest bids—on average 1.9 per contract. Nordås suggests that this could be due to the high cost of preparing bids in this segment.
Share of Norwegian suppliers
The number of bids per segment is especially interesting when viewed alongside the share of contracts awarded to Norwegian companies (including foreign firms with Norwegian subsidiaries). Across all three project phases—exploration, development, and operations—the combined Norwegian share was 78 percent, though this varied by service category.
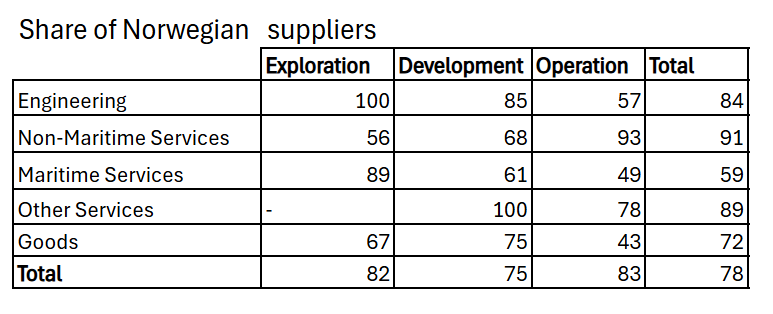
Maritime services stood out with both a relatively high level of competition (2.9 bids per contract on average) and the lowest share going to Norwegian suppliers (59 percent). This segment faced more international competition, likely because maritime services are more mobile and can be deployed globally.
Norwegian engineering firms, by contrast, were more tailored to local conditions—giving them a natural competitive advantage. Statoil also had an explicit policy of promoting Norwegian participation, and engineering services were probably among the segments where this was most feasible. At the same time, the bidding data suggests that a high Norwegian share was likely regardless of policy: most of the potential bidders were domestic.
On average, there were only 0.2 foreign bidders per contract in this segment. Roughly 10 percent of bids came from non-Norwegian companies, while 15 percent of the total contract value went abroad.
When looking across all market segments, there was a weak tendency for contracts with fewer bidders to go to Norwegian suppliers more often. However, the correlation is not statistically significant.[REMOVE]Fotnote: It is based on an OLS regression, conducted by the author of the article, in which the share of Norwegian suppliers in a given phase and segment is considered a dependent variable, stated as a function of “average number of bids per contract”, (which is the independent variable). The resulting function is: Yi = 77.43 – 1.34Xi + ui. The coefficient of –1.34 indicates a negative correlation but is not statistically significantly different from zero. It should be noted that the division into market segments and project phases results in a very small number of observations.