
One of Tampen’s Three Billy Goats Gruff

In many ways, Gullfaks is the middle Billy Goat Gruff: Statfjord started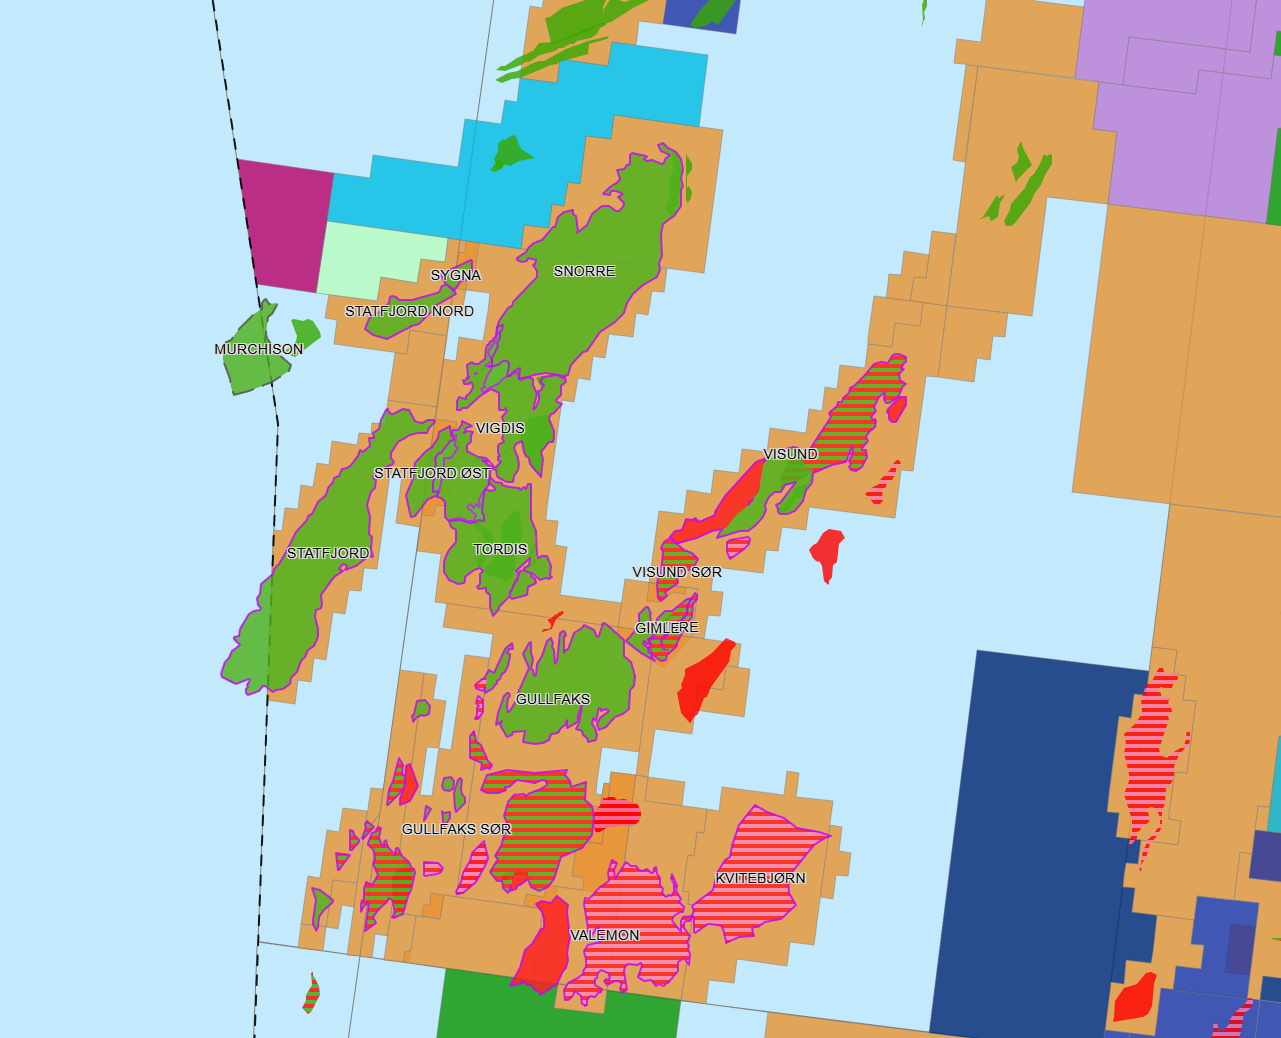
production first (1979) and has by far the largest reserves. Snorre is the
smallest goat, although the gap in original reserves is somewhat smaller
between Gullfaks and Snorre (approx. 100 million Sm³ o.e.[REMOVE]Fotnote: “Mill. Sm³ o.e.” is an abbreviation for million standard cubic metres of oil equivalents.) than between Gullfaks and Statfjord (approx. 300 million Sm³ o.e.); see the table:
| Field | Start-up (year) | Orig. reserves | Of which, oil | Remaining res. (2023) |
| Statfjord | 1979 | 717,92 | 582,85 | 16,5 |
| Gullfaks | 1986 | 418,94 | 390,48 | 14,4 |
| Snorre | 1992 | 318,40 | 302,71 | 65,8 |
Table 1: Figures in million standard cubic metres of oil equivalent (Sm³ o.e.). [REMOVE]Fotnote: Source: Norskpetroleum.no for Statfjord, Gullfaks and Snorre.
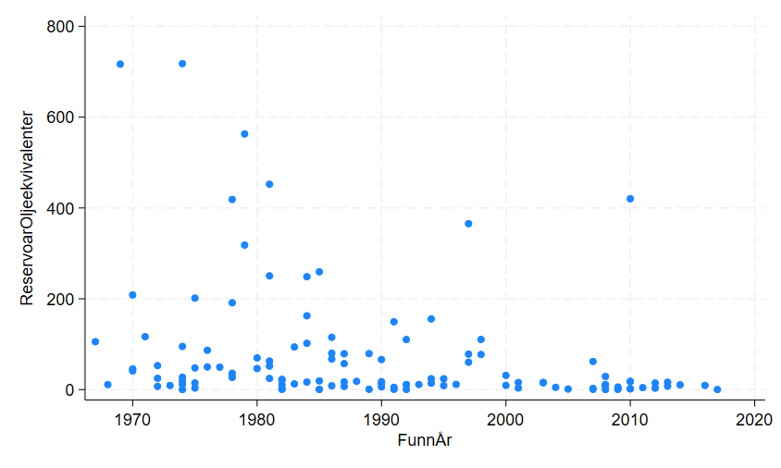
Tampen’s development also reflects a broader trend: newer fields often have
smaller reservoirs than older ones, as the Norwegian continental shelf (the
North Sea in particular) has become more explored and mature. There are
exceptions—such as Johan Sverdrup (see the lone blue dot at 2010 in the figure
below).
The Three Billy Goats Gruff and the Troll
If we stick with the fairy‑tale analogy, it is only natural that the goats test
themselves against the Troll. As a petroleum field, this giant beats the other
three—both individually and combined—with 1,773.46 million Sm³ o.e. But as an
oil field, Troll is a different story: with an oil portion of 296.11 million
Sm³ o.e., Troll loses out to the smallest (Snorre, 302.71), the middle
(Gullfaks, 390.48) and the largest (Statfjord, 582.85) Billy Goat Gruff. The
last of these is in fact nearly twice Troll’s size in oil.
Milestones in the fields’ early history
The timing of discovery, Plan for Development and Operation (PDO) approval, and
platform start‑up—the “three Ps”—helps explain the production story (for the
production history, see the next heading).
Chronologically, Statfjord stayed ahead of Gullfaks throughout. Four to seven
years typically separated comparable milestones in the two fields’ histories—as
the table below shows. Snorre sits close to Gullfaks on discovery (1978 and
1979, respectively), but it took 11 years before the first PDO was approved,
another four years to first oil on Snorre A, and then a further nine years
before Snorre B started up in 2001.
| Event / Field | Statfjord | Gullfaks | Snorre |
| Discovery | 1974 | 1978 | 1979 |
| PDO approved (first time) | 1976 | 1981 | 1988 |
| Start-up, A platform | 1979 (24 Nov.) | 1986 (22 Dec.) | 1992 (03 Aug.) |
| Start-up, B platform | 1982 (05 Nov.) | 1988 (29 Feb.) | 2001 (June) |
| Start-up, C platform | 1985 (26 June) | 1989 (04 Nov.) / 1990 (own wells) | |
Table 2: The DPS history of the three fields.
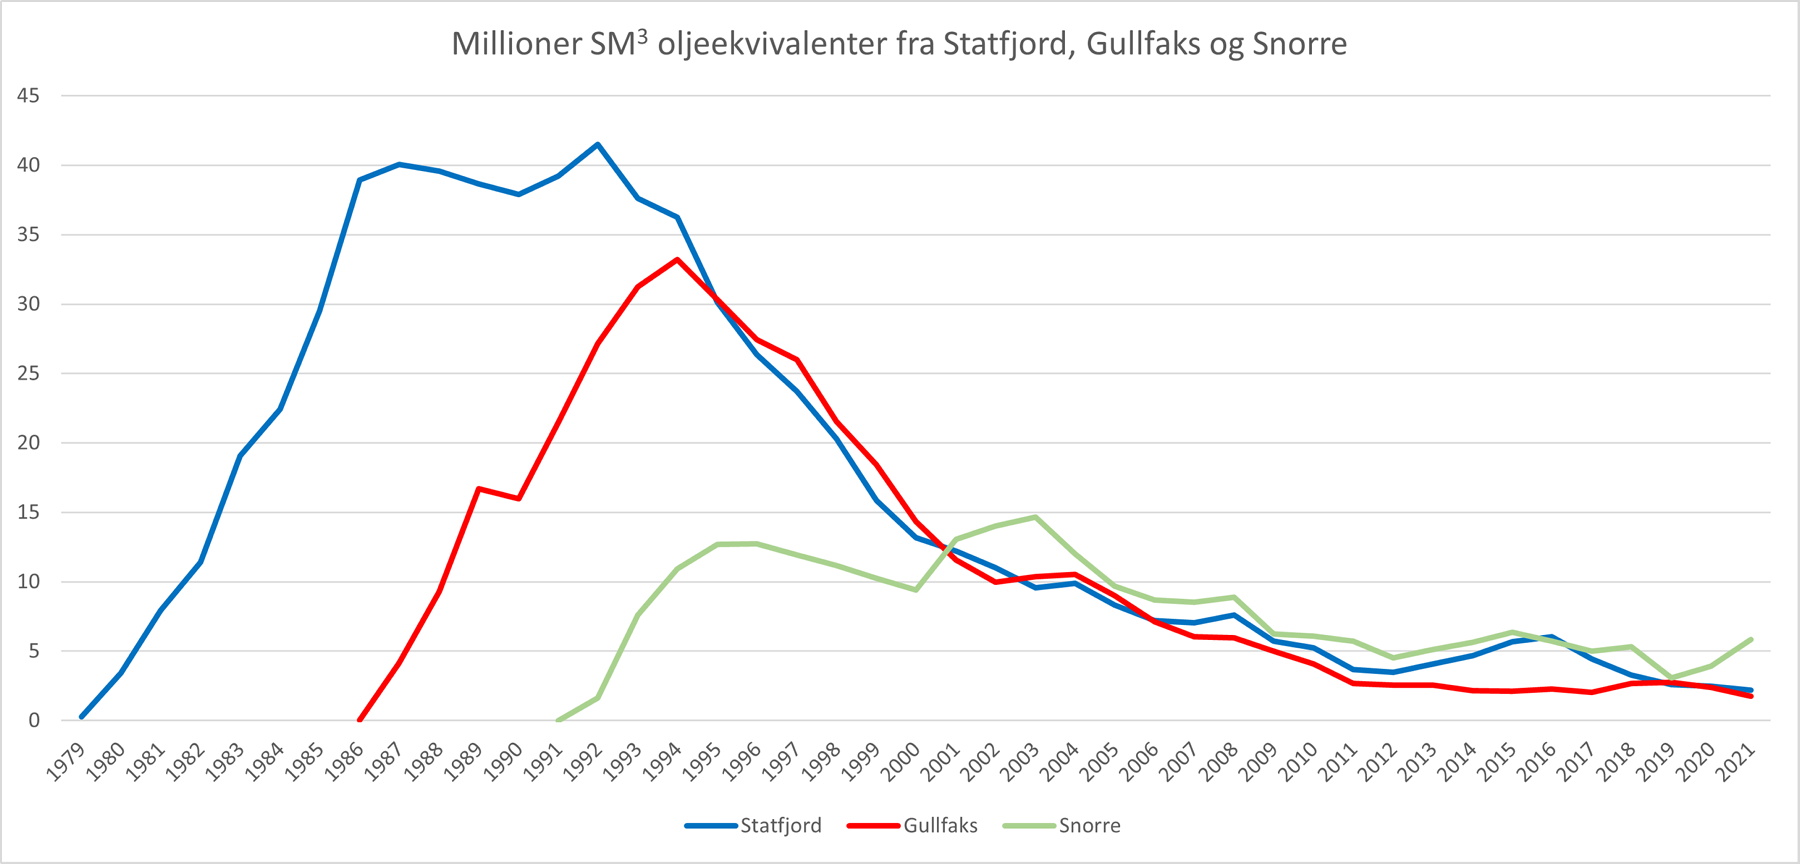
Production history
What characterizes a typical oil field’s production profile? Norskpetroleum.no
describes it as a rapid ramp‑up to peak, followed by a multi‑year plateau,
then a gradual decline.[REMOVE]Fotnote: https://www.norskpetroleum.no/produksjon-og-eksport/produksjonsprognoser/
On Tampen, the production histories are mixed. Development concept matters:
here Statfjord and Gullfaks group together. Both were built out with three
large Condeep gravity‑based platforms that started up one to three years apart.
For Gullfaks, output rises fairly steeply in step with the platforms coming on
line—1986 (Gullfaks A), 1988 (B) and 1989/1990 (C). Statfjord shows much the
same pattern, with first oil in 1979 (A), 1982 (B) and 1985 (C). Both thus fit
the textbook definition: a fairly steep climb to a peak/plateau, followed by a
gentle decline into tail‑end production.[REMOVE]Fotnote: Figures 1 and 2 are placed and dimensioned according to time/chronology and scale (the x- and y-axis), so that they are easier to compare. Snorre stands out with a more jagged curve, mainly because the two main development phases are nine years apart (1992 and 2001). The first phase declines before Snorre B lifts production again.
Not quite the end of the tale
In sum, Gullfaks is the middle Billy Goat Gruff on Tampen in reservoir size
(and in timing of start‑up). Otherwise, Gullfaks and Statfjord have more in
common with each other than with Snorre—platform type and count, and the
three‑P timeline. All three lose to Troll on gas, but the ranking flips if you
look only at oil reserves. Although Tampen’s heyday is likely behind it, life‑
extension measures mean it will be many years yet before we can say the fairy
tale is over for the area’s three petroleum goats.