
Gullfaks by the Numbers

A large field
By Norwegian standards, Gullfaks is a large oil field.[REMOVE]Fotnote: The Norwegian Offshore Directorate estimated in 2024 that the original recoverable resources amount to 418.9 million standard cubic meters of oil equivalent, of which the vast majority (390.8) is oil.In terms of oil reserves alone, it is the fifth-largest in the country, and seventh-largest when including gas and NGL. The diagram below shows the 20 largest fields in Norway, with Gullfaks in seventh place.
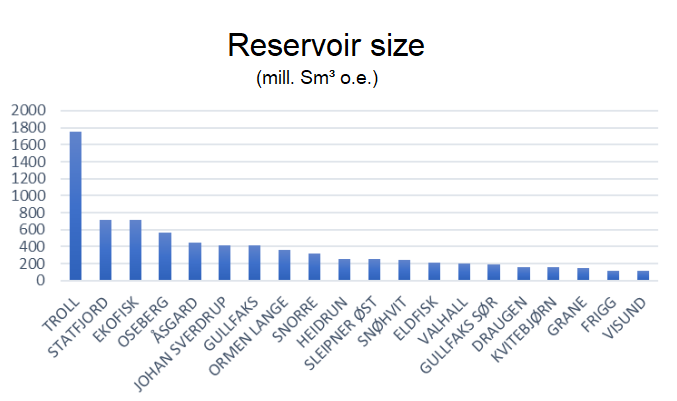
The size of the Gullfaks reservoir has been significantly revised upward over the field’s lifetime. At production start in 1986, estimated recoverable reserves were around 1.32 billion barrels of oil, and the field was expected to remain in production until 2007. The estimated amount of energy from Gullfaks in 1986 equaled almost 15 times Norway’s electricity production in 2022.[REMOVE]Fotnote: One barrel of oil equals 1,637.6 kWh. 1,320,858,000 barrels × 1,637.6 = 2,163 TWh.
Norway’s electricity production in 2022 was 146 TWh. The ratio is 14.81This figure has since doubled due to new discoveries and technological advances. The original Plan for Development and Operation (PDO) estimated a recovery rate of 44 percent. As of 2024, this rate has passed 62 percent.[REMOVE]Fotnote: Norwegian Offshore Directorate. (2019). Gullfaks – suksesshistorien i gullblokken [Gullfaks – the success story in the golden block]. In Ressursrapport 2019. https://www.sodir.no/aktuelt/publikasjoner/rapporter/ressursrapporter/ressursrapport-2019/felt/gullfaks-suksesshistorien-i-gullblokken/gullblokken/
Gullfaks reached peak annual production in 1994, with 33.21 million standard cubic metres of oil equivalents produced. Measured as primary energy, this was three times the total electricity production in Norway that same year.[REMOVE]Fotnote: 209,000,000 barrels = 342 TWh. Norway’s total electricity production the same year was 121.82 TWh. The ratio is 2.8.
By 2021, 27 years later, Gullfaks produced just five percent of what it did in its peak year. This places the field firmly in its tail production phase. Nevertheless, production is estimated to continue until 2040, even though only 3.43 percent of the original recoverable reserves remain.[REMOVE]Fotnote: Equinor. (2016, December 22). 30 år med Gullfaks-olje [30 years of Gullfaks oil]. Equinor. https://www.equinor.com/no/news/archive/30-years-gullfaks-oil
Expensive
Developing and operating a field like Gullfaks is costly. When all investments from 1981 to 2023 are summed and adjusted for inflation, the total comes to approximately NOK 202 billion in 2021 value. This makes Gullfaks the third most expensive field in Norway, after Troll and Ekofisk. It has cost more to develop and operate than both Oseberg (NOK 180 billion) and Statfjord (NOK 200 billion), even though those two fields have had higher production.
The costs associated with Gullfaks are 60 percent higher than what the field’s size, oil share, production start year, and recovery rate would typically suggest.[REMOVE]
Fotnote: Kvadsheim, O. (2024, November 22). The price of a state oil company [Working paper]. Norwegian Petroleum Museum. https://www.norskolje.museum.no/wp-content/uploads/2024/11/The-Price-of-a-State-Oil-Company.pdf
The most likely explanations for the high cost include the use of pioneering technology and the complexity of the reservoir.[REMOVE]Fotnote: These three components are not accounted for in the regression model (see previous footnote), and therefore represent possible explanations for why the field has incurred 60 percent higher costs than what the reservoir’s size, oil share, recovery rate, and production start date would suggest.
It is also possible that cost control was weaker at Gullfaks compared to other fields.
The probability and scale of budget overruns on the Norwegian continental shelf tend to decrease with operator experience, measured by how many other licenses the company operated during the development period.[REMOVE]Fotnote: Lorentzen, S., Oglend, A., & Osmundsen, P. (2017). Cost overruns on the Norwegian continental shelf: The element of surprise. Energy, p. 10.Given that Statoil was still a relatively inexperienced company in the early 1980s, this likely contributed to poorer cost control.
Statoil also differed from other companies in being a tool for achieving political goals. This may have influenced the extent to which contracts were awarded to Norwegian suppliers. For Gullfaks A, B, and C, 80 percent of all deliveries went to Norwegian firms.[REMOVE]Fotnote: Nordås, H. K. (2000). Gullfaks: The first Norwegian oil field developed and operated by Norwegian companies. Chr. Michelsen Institute, Development Studies and Human Rights. https://open.cmi.no/cmi-xmlui/bitstream/handle/11250/2436110/WP2000-13.pdf?sequence=2&isAllowed=y
If this share was higher than what purely commercial operators would have chosen, it suggests that Statoil prioritised national suppliers over cost minimisation.
Another example is that Gullfaks, unlike other fields at the time, featured more single-occupancy cabins than shared ones, and none with four beds.[REMOVE]Fotnote: Thommasen. E. Middel og mål Statoil og Equinor 1972-2001. Universitetsforlaget 2022, s. 218
Pioneering technology is another possible explanation for Gullfaks’ high costs. Large projects are, on average, more vulnerable to budget overruns when they involve new technological solutions. This is partly because the project scale makes it more difficult to implement major changes in response to rising cost estimates.[REMOVE]Fotnote: Lorentzen.S, Oglend. A, Osmundsen. P. Cost Overrunns on the Norwegian continental shelf: The element of surprise. Energy 2017 s. 3
Finally, field complexity may also be a factor. If the oil at Gullfaks was harder to extract than at other similarly sized fields, this would naturally increase costs. Compared to other large fields, Gullfaks has certainly been expensive. But its size also provides economies of scale, which helps reduce the cost per barrel. When the total investments are divided by the total production, the average cost of producing a barrel of oil from Gullfaks is NOK 79.6 (in 2021 value). That is remarkably close to the average for all oil equivalents produced on the Norwegian shelf: NOK 79.2.[REMOVE]
Fotnote: Investment figures for each field from the Norwegian Offshore Directorate have been adjusted for inflation using Statistics Norway’s price calculator, then summed and divided by the number of oil equivalents produced up to 2022. In that sense, Gullfaks may be the most average oil and gas field in Norway. However, because the field is so large, its production should ideally have been much cheaper than average.
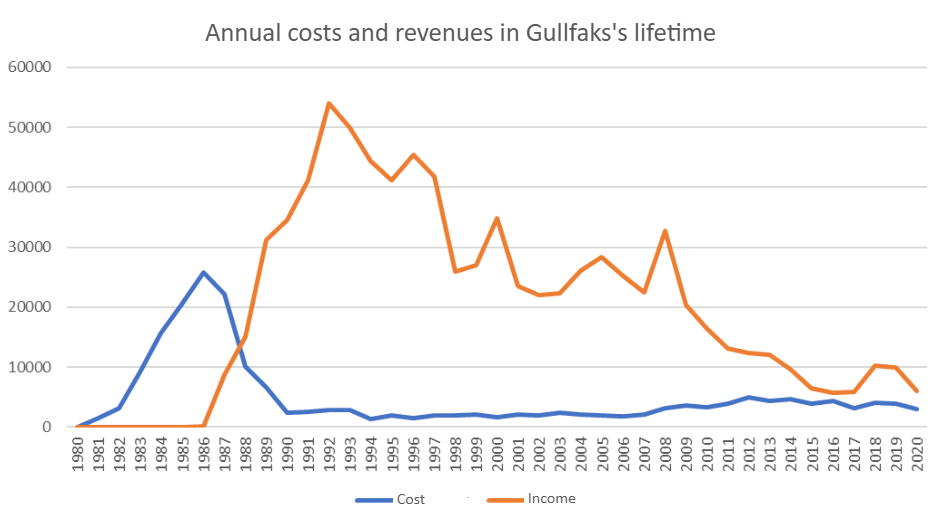
Profitable
Despite the heavy investment, Gullfaks has been highly profitable. A rough estimate places the field’s inflation-adjusted revenues at about four times the total investments: NOK 835 billion in 2021 value.[REMOVE]Fotnote: The estimate was calculated by multiplying annual production (oil and gas), measured in oil equivalents, by the average oil price and exchange rate for the given year. The resulting amount (for both investment and income) was adjusted for inflation using Norway’s consumer price index. This is therefore a rough estimate and does not account for the actual sale price (e.g., unique quality characteristics of Gullfaks oil relative to Brent). Figures for production and nominal investments were retrieved from the Norwegian Offshore Directorate. That corresponds to just over half the Norwegian state budget in 2021.
In addition to overall profitability, it is worth considering the payback period — how long it took before the field became profitable. Initially, Gullfaks had negative cash flow due to development costs. Investors also require a return on their capital.
Offshore oil investments have characteristics that lead companies to demand relatively high returns.[REMOVE]Fotnote: For further discussion of these characteristics, see: Finansdepartementet. (2018). NOU 2018: 17 Klimarisiko og norsk økonomi [Climate risk and the Norwegian economy] (Annex 5). Regjeringen. https://www.regjeringen.no/no/dokumenter/nou-2018-17/id2622043/
If the expected return is, for instance, 13 percent, it means investors require a 13 percent annual return on their investment. Investing NOK 1,000 in 1981 would mean expecting NOK 1,130 in returns in 1982, or NOK 2,080 in 1987.
The chart below illustrates how long it took before Gullfaks reached break-even, depending on the assumed rate of return (13, 7, and 0 percent).
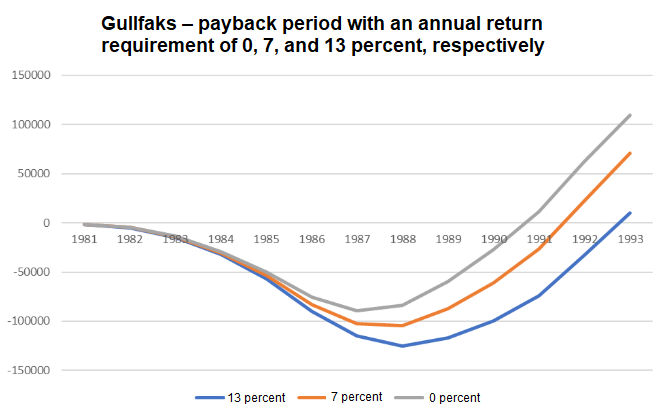
The 7 percent and 13 percent figures are chosen because the state applies a 7 percent return requirement for offshore investments, while private capital markets in 2018 were estimated to require 13–14 percent. [REMOVE]
Fotnote: Finansdepartementet. (2018). NOU 2018: 17 Klimarisiko og norsk økonomi (Vedlegg 5). Regjeringen. https://www.regjeringen.no/no/dokumenter/nou-2018-17/id2622043/
The actual rate of return companies use for 2024 investments is not publicly known.
The orange line shows when the state would consider the field to have paid off (1991/1992). The blue line reflects when a private investor would consider the same (1992/1993). The grey line shows when Gullfaks broke even without any expected return on investment — in other words, when total revenues equaled total investments. This occurred in 1990/1991. Compared to several other oil and gas fields, Gullfaks had a long payback period.
Summary
Gullfaks is one of Norway’s largest oil fields. In theory, that should mean that producing a barrel of Gullfaks oil would be significantly cheaper than the Norwegian average. That has not been the case. On average, Gullfaks oil has cost about the same to produce as oil from the rest of the shelf. The reasons are not entirely clear, but possible explanations include reservoir complexity, weaker cost control, and the use of newer or suboptimal technology. Despite high costs, Gullfaks has been highly profitable, generating roughly four times as much income as it cost to develop and operate.