
A Tough Start, but Profitable Production

When Statoil conducted its profitability study for Gullfaks in 1980, the company assumed an oil price of USD 35 per barrel as the basis for its calculations.[REMOVE]Fotnote: Statoil ASA. (1980). Drivverdighetsstudie, bind I: Sammendrag og konklusjoner. S. 39 (Arkivreferanse: AV/SAST-A-101656/0001/D/Dc/L0831/0003). Sentralarkivet/Fjernarkivet, Saks- og korrespondansearkiv, konsernarkivet. The reality turned out quite differently. Between November 1985 and July 1986, the oil price dropped from USD 29.8 to USD 9.5 per barrel. Adjusted for inflation, USD 9.5 corresponds to just over USD 30 per barrel in 2023 dollars. A weak U.S. dollar at the time (an average exchange rate of 6.74 NOK per dollar in 1987) made the price drop feel even more severe for Norwegian oil producers.
At that point, oil prices were only just above the level needed for Gullfaks A to break even. In its 1980 profitability study, Statoil had analyzed how sensitive Gullfaks’ returns would be to oil price changes. The study concluded that if the real oil price declined by 2 percent annually (from the starting point of USD 35), it could reduce the project’s after-tax net present value for Phase I by as much as 83 percent.[REMOVE]Fotnote: Net present value refers to the current value of future revenues and costs. By calculating net present value, one accounts for the fact that a dollar a year from now is worth less than a dollar today.
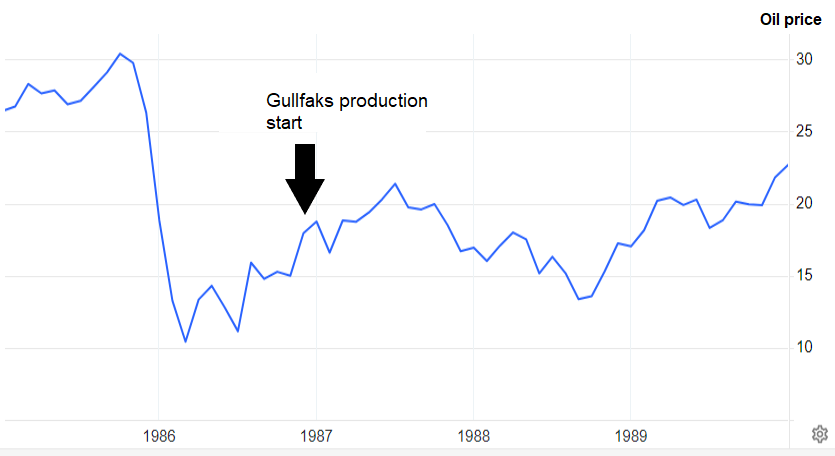
The graph below shows the oil price per barrel in nominal dollars from 1984 to 1989. As the graph illustrates, the situation had improved somewhat by the time Gullfaks came online compared to the lowest point in the summer of 1986 — but it would take many years before prices returned to pre-collapse levels.
In response to the oil price fall, a major cost-cutting initiative — called “Delta” (Daily Efficiency) — was launched to reduce Gullfaks’ lifetime operating costs from NOK 65 billion to NOK 50 billion in 1988 kroner. The project involved employees across the entire Gullfaks organization.[REMOVE]Fotnote: Statoil. (1990, november). Gullfaks – glimt fra historien om et helnorsk oljefelt. Den norske stats oljeselskap a.s. Stavanger. Side 12. https://www.nb.no/items/4f4ceb82f9be24c64834e1a04a0a7ca1?page=0&searchText=helnorsk
Below USD 20 per barrel during peak production
In December 1987, one year after Gullfaks A began producing, OPEC set an official target price of USD 18 per barrel for the coming year. However, weak compliance among OPEC members led to market prices fluctuating between USD 14 and USD 20 per barrel that year. Statoil achieved an average price of USD 18.5 per barrel in 1987. During this period, Norway cooperated with OPEC on production cuts to help lift prices. Part of those cuts were reportedly made at Gullfaks.
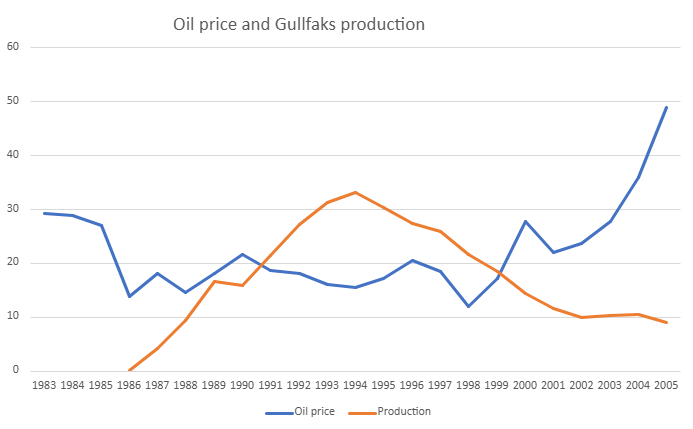
Despite production limits, the oil price hovered around USD 20 for much of the time Gullfaks operated at peak production. The field was brought online too late to benefit from the high prices that lasted until 1986 — and by the time prices began climbing significantly again in the early 2000s, Gullfaks was well into its late-life production phase.
The graphs below show Gullfaks’ annual production (in million standard cubic meters of oil equivalent) and the average annual oil price (in USD). Gullfaks achieved very high production volumes during years when oil prices were relatively low.
Clearly profitable to operate Gullfaks
Although major investments were required to develop Gullfaks, and although low oil prices extended the time needed to recover these investments, the field’s operations were consistently profitable.
Norwegian oil and gas fields generally have high development costs but low operating costs compared to other countries.[REMOVE]Fotnote: Statoil. (1990, november). Gullfaks – glimt fra historien om et helnorsk oljefelt. Den norske stats oljeselskap a.s. Stavanger. Side 12. https://www.nb.no/items/4f4ceb82f9be24c64834e1a04a0a7ca1?page=0&searchText=helnorsk Gullfaks was no exception. In the early years after startup, the cost to produce one average barrel of oil from Gullfaks was less than one U.S. dollar. Once the platform was built and operational, it would have taken a major collapse for annual production to run at a loss.[REMOVE]Fotnote: The figures are sourced from the Norwegian Offshore Directorate’s fact pages and converted to U.S. dollars based on the average exchange rate for the respective year.
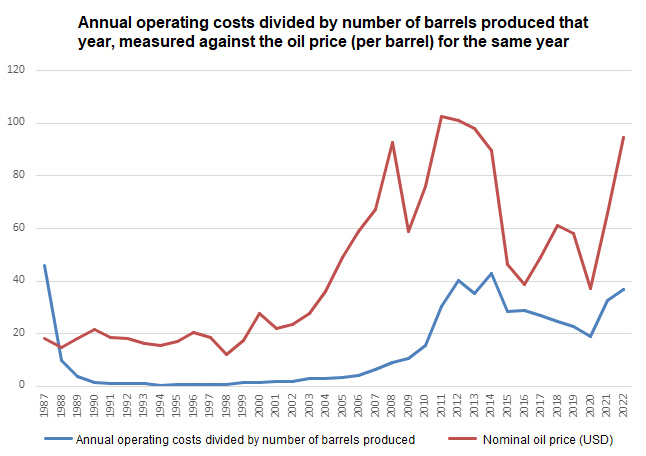
Aside from the initial startup years of 1986 and 1987, Gullfaks has turned a profit every single year. The graph below shows the annual costs associated with Gullfaks (converted to dollars), divided by the number of barrels of oil equivalent produced in the same year. For comparison, the oil price for each year is also shown. Oil prices consistently remained well above production costs from 1988 onward.
In summary, despite an unfortunate start in terms of oil prices, Gullfaks has clearly been a profitable project, even when you include the development costs.